Reproducible Analysis
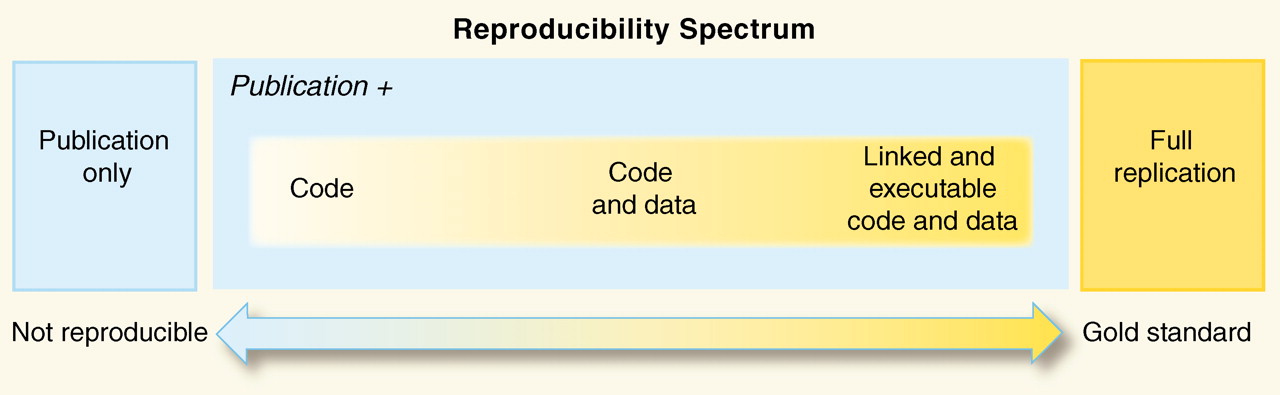
The reproducibility of scientific data analysis has become an interesting topic recently, a quick google search reveals numerous MOOCs, blogs, and articles talking about the importance, and lack, of reproducible analysis. The figure below shows the “reproducibility spectrum” as defined by Roger D. Peng.
The aim of reproducible research is that anyone else should be able to access the data and analysis method used on a particular piece of research and perform the same analysis and get the same results. The use of Python can really improve this, as the programmatic nature means that the same processes will be performed in the same order every time.
I have recently been working on the analysis of some experimental X-ray and neutron reflectometry measurements, and in the process of writing a manuscript about the work, I determined to make a “completely reproducible workflow” for the analysis. This manuscript has now been published in Physical Chemistry Chemical Physics, so I felt it would be suitable to discuss how I implemented my first reproducible analysis workflow, in Python. The whole workflow can be found in the electronic supplementary information for the manuscript which is available on GitHub.
The first task was to use Make to create the workflow, this allowed the paper to be written in LaTeX and generated at will. Each of the additional steps discussed below was included in the Makefile.
Each of the analyses was written as a Jupyter notebook initially when the Makefile was run nbconvert was used to convert this to a Python script and run the script (with different input parameters for different analyses). In future papers, I will likely remove the Jupyter notebook stage, unless I want to include textual information as Markdown in the analysis script (which I really should do in the future but time isn’t infinite).
The analysis scripts will either output a figure or some data, the figures are included in the TeX file with the correct path, and the data are stored as TeX formatted strings that can be included using the \input{path} command.
This meant that I could have all the data stored as nice formatted string (with experimental uncertainty etc.), however I think there is scope to improve this and build a system for generating these strings with all the uncertainties, units, etc. (that is a project for future Andrew [or maybe James Grant]).
This meant that each time Make was run if anything in the data changed the necessary analyses could be run and the paper “rewritten” to obtain the most up to date information.
I found this particularity useful when writing the paper, as each time I changed the analysis it was simply a matter of typing “make” and the new paper, figures, and data would be generated.
One aspect that is important for reproducibility with Python, is that all of the packages that are imported must run the same version as when the initial data was analysed, or else weird problems might occur.
To achieve this I included a pip requirements file in the GitHub repository that included version numbers.
However, the use of conda environments might be a better path in future or as Ben Morgan does have a read out of the current python environment at the end of the analysis workflow.
Another aspect was that many of the analyses required initialisation of a random sequence, which could result in small changes with each run.
However, the packages used enabled the seeding of this random number such that the same numbers always came out the other end.
These are just some ideas, and in no way the be all and end all of the reproducible analysis conversation, so if anyone has thoughts that they would like to share please get in touch.