Statistical Models: Turning Data into Understanding#
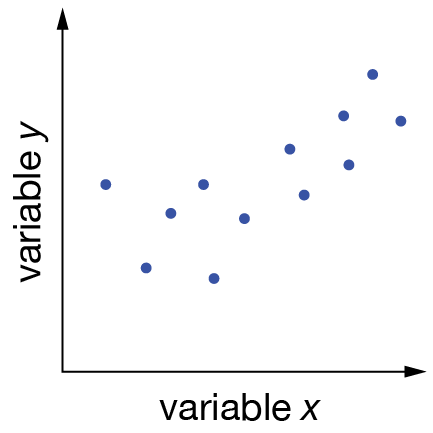
Statistical models provide a formal way to represent relationships between variables. When working with experimental or computational data, we typically have a set of independent variables, \(x\), and a set of dependent variables, \(y\). Our goal is to describe the general relationship between \(x\) and \(y\) with some mathematical function, \(y = f(x)\).

Fig. 1 What is a reasonable description of the relationship between \(x\) and \(y\) for this dataset?#
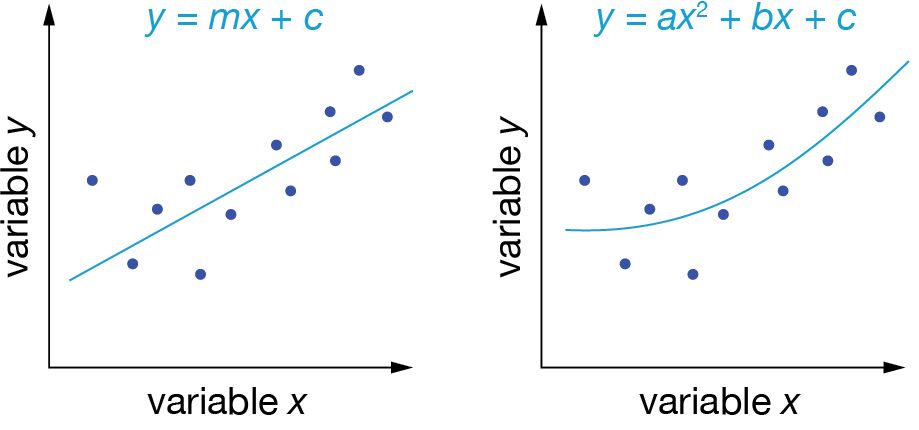
Model fitting involves two distinct steps. First, we must choose the functional form of our model — that is, decide on the general mathematical structure that we think describes our data. We might choose a linear relationship (\(y = mx + c\)), a polynomial (\(y = ax^2 + bx + c\)), or an exponential decay (\(y = Ae^{-kx}\)). Each of these functions represents an entire family of possible models with the same basic mathematical structure.

Fig. 2 Which functional form best describes our data?#
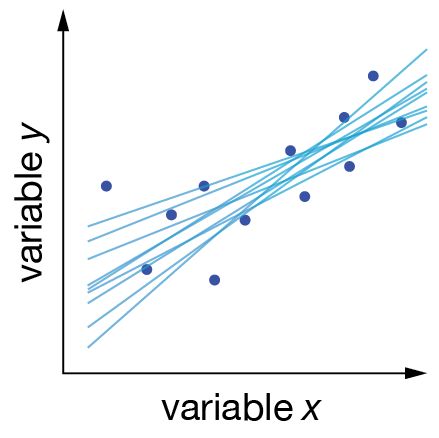
Once we have chosen a functional form, the second step is to find the specific parameters that make our model best match our data. Consider a linear model: while we’ve decided our data should follow a straight line (\(y = mx + c\)), we still need to determine which straight line best fits our observations. There are infinitely many possible combinations of slope (\(m\)) and intercept (\(c\)), and each one gives us a different straight line. Our job is to find the values that give us the “best” fit to our data.

Fig. 3 These linear models all approximately describe our data. Which one is “best”?#
