
Exercises#
The main exercise for this session is to check that you can login to the JupyterHub server, launch a Notebook, and execute code and Markdown cells.
1. Launching a Notebook#
Login to the JupyterHub server.
Create a new Notebook (rename this to something sensible).
Then launch the User Interface Tour.
2. Hello World#
In the tradition of nearly every introductory programming tutorial, you are going to make the computer print “Hello world”. When entering code from the Course Book into your Notebooks, we strongly recommend that you type the code out, and do not just copy and paste. Typing the code will give your brain long enough to register what you are actually doing, and has the side benefit that you will make at least a few mistakes that you can then practice fixing.
You should have a pristine Notebook from completing Exercise 1. The first cell will be a code cell. Type the following into your code cell and run the cell using ⌘+Enter, or clicking the Run Toolbar button.
print("Hello world")
When you run this cell, you should get output that looks like:

The cell has executed, and produce Hello world as output, and a new empty code cell has been created underneath. Notice that the In [ ] next to the top cell now shows In [1], showing the order of execution of cells.
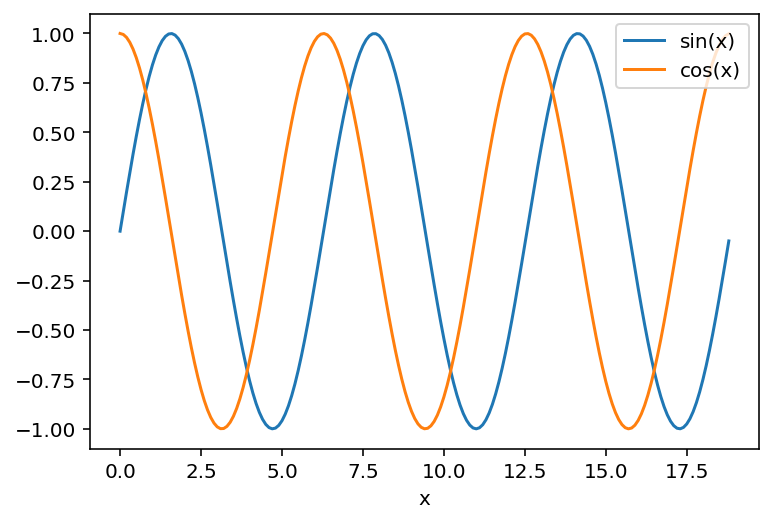
3. Plotting sin(x) and cos(x)#
Common uses of Python within scientific work are numerical calculations and the plotting of data. We will be covering both of these in detail in later sessions. As an example however, type the following code into a code cell and run the cell:
import matplotlib.pyplot as plt
%config InlineBackend.figure_format = 'retina'
import numpy as np

x = np.arange(0, 6*np.pi, 0.1)
plt.plot(x, np.sin(x), label='sin(x)')
plt.plot(x, np.cos(x), label='cos(x)')
plt.xlabel('x')
plt.legend()
plt.show()
Do not worry if none of this makes sense. It will all be covered later in the course.
When you run the cell you should get the following output plot, showing how a few lines of Python can be used to perform a numerical calculation (in this case calculating sin(x) and cos(x) for a range of x values) and the plotting the resulting values.
4. Embedding a YouTube video#
Because Jupyter Notebooks are (interactive) webpages, they can display rich media. The following code will embed a YouTube video into your notebook (you probably will want to copy and paste this example, instead of copying it):
from IPython.display import YouTubeVideo

YouTubeVideo('dQw4w9WgXcQ', width=800, height=300, autoplay=True)