Exercises#
The first exercise was to read in the IR spectra data for toluene using the np.loadtxt function.
First, we need to check the structure of the file, with the !head command.
!head toluene_ir.csv
# toluene
# wavenumber (cm-1), transmittance
579.481, 0.641
587.912705, 0.628
596.34441, 0.5971
604.776115, 0.577
613.20782, 0.5769
621.639525, 0.5798
630.07123, 0.5918
638.502935, 0.6108
It is a column-order orders, comma-separated values file. Therefore, we import this data with the following.
import numpy as np
wavenumber, transmittance = np.loadtxt('toluene_ir.csv', unpack=True, delimiter=',')
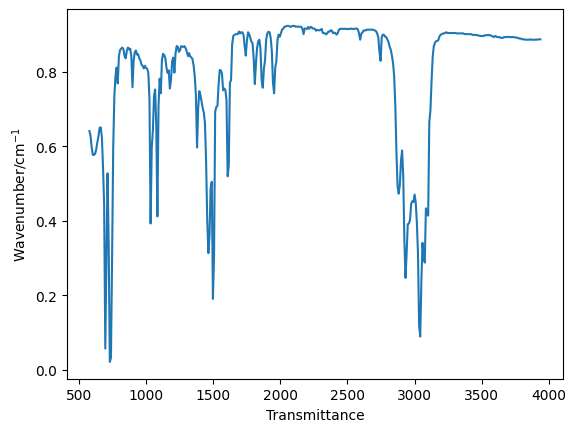
We can then plot the data, using the information in the file header.
import matplotlib.pyplot as plt
plt.plot(wavenumber, transmittance)
plt.xlabel('Transmittance')
plt.ylabel('Wavenumber/cm$^{-1}$')
plt.show()